A program for determining processor and card load. Monitoring the processor and video card in the game. Small but useful tools
 Hello everyone, I would like to tell you how to find out what the processor load is in this moment. I'll show it on Windows example 7, but in other versions of Windows everything is about the same. The processor is perhaps the most important device in a computer and indeed in other similar equipment, well, I mean PDAs, tablets and even smartphones.
Windows 7 allows you to see how much the processor is loaded at a given time and by which program. You know, some users buy a powerful processor, which is cool, of course, but they buy it so that nothing freezes on the computer. And I understand this too. But the funny thing is that with such a processor nothing really slows down, and all because a modern top-level processor is so powerful that the computer will work quickly even if there is a lot of garbage on it. This is all to say that in fact, a computer can quickly work even on a processor that was ten years old. It's all about optimization, which today simply means that there is no unnecessary programs, which you don’t need.. And that’s all..
Well, of course, I don’t mean some kind of Pentium on socket 478, there will most likely be slowdowns. But for example, Windows 10 can easily run on the same Pentium D (775 socket) and at the same time it’s even fast
So, let's move on to our topic. To find out how busy the processor is, you first need to launch the task manager. To do this, right-click on the panel and select this item:

The dispatcher will open, there we immediately go to the Performance tab:

Do you see any graphs there? Well, there is a CPU Load graph, and it shows the CPU load as a percentage. Opposite this column you may notice a graph or graphs above which it says CPU Load History. These graphics, that's how many there are, that's how many cores your processor has. But there is another problem that Windows takes threads as cores, in order to find out how many threads and how many cores, I recommend using free utility CPU-Z.
On these graphs, Load and History, you can see how much the processor is loaded in real time. In general, I hope you understand. Now how can you find out which program is loading the processor? For example, I will run and enable the performance test there:

That is, I specially created a processor load and now see how to find out who exactly is loading the processor. In the manager, go to the Processes tab and there click on the CPU column and carefully look at who has the most percentage:

Well, as you can see, it’s easy to understand that the WinRAR.exe process is loading the percent! If you don’t know what kind of program it is, you can look in the Description column, the name of the program is usually indicated there. But it may be that it is empty. Then right-click on the process and select open storage location, the folder where the process started will open. Look carefully at the folder name, it may tell you what kind of program it is. Well, here’s an example, here’s the folder where the WinRAR.exe process started:

At the top you can see the name open folder, in this case this name is the same as the name of the program. Well, I think that everything has already become clear to you.
In Windows 10, it’s a little easier to see who is loading the percent, there you just need to go to the Processes tab in the manager, click on the CPU column on the left in the Name column, you will see what kind of program it is, in general, everything is almost the same, only it’s more convenient somehow everything is done:

Well, as a bonus, I’ll show you how to find out how many processor threads you have and how many cores you have. As I already wrote, if the processor supports Hyper-threading technology, then Windows itself will show threads as kernels in the manager. However, there is a way to see how many threads there are, it’s just a little tedious. You need to create any file with the nfo extension and open it, there will be a message saying something like it cannot be opened, and then after clicking OK a window will appear. There will be a line where the processor model and how many cores and also how many logical processors will be indicated. These are the flows!
Regarding threads, in Windows 10 there is already a division, well, that is, it indicates how many cores and how many threads, look where the threads are indicated (and the cores are higher):

But advanced users still use the CPU-Z utility
CPU-Z is easy to download on the Internet, it’s available in almost every corner, it’s a free and small utility, it’s easy to install, or even not necessary at all if the version is portable. Just downloaded and launched, for example, I have a Pentium G3220 processor and this is what the utility showed, there is enough information.
If you need monitoring of the processor and video card in the game, and at the same time you would not refuse to display the frame rate (FPS) during the game, then the easiest way to get all this for free is install MSI Afterburner.
The program is simple and intuitive, its only drawback is that the default interface buttons are very small.
MSI Afterburner can monitor all the parameters a player needs:
- GPU temperature.
- CPU temperature.
- The load level of both, to determine the “bottlenecks” of the system.
- Frame rate (FPS).
- Video card cooler rotation speed.
- As well as many other indicators that are not so necessary for the average gamer, such as frequencies and voltages, as well as information about the swap file. Of course, you decide what to monitor and display on the Overlay Screen Display (OSD).
- MSI Afterburner can also capture videos and screenshots, and overclock the video card. In general, complete stuffing!
Data can not only be monitored, but also displayed on the screen during the game to enjoy real-time numbers without minimizing the game every minute. By the way, along with all these statistics, you can also display a clock on the screen, which can be very convenient.
One of the features of the program is that peak values are displayed on monitoring graphs, so there is no need to scroll through the graphs - just glance at the red numbers above them.
Setting up MSI Afterburner
To begin, click the Settings button at the bottom of the program panel:

At the top of the window that appears:
- select the “Monitoring” tab;
- We check the boxes on the list items that we want to monitor. Drag the lines with your mouse in the order in which you want them to appear in the game;
- While a line item is selected, you can assign it whether it will be displayed in the OED during the game or not (and at the same time color, name, and other properties).
As you can see, in the screenshot Frame Rate is not checked, but usually it should be checked unless your FPS is displayed by the game itself or another program.

After this, I advise you to look at what is hidden in other tabs of this panel, especially in the far right - Interface.
Setting up the MSI Afterburner OED
So, to configure the display of FPS and monitoring data during the game, in the same settings panel, find the OED tab, and there the “Advanced” button. Click it!

The OED settings window has opened. In it you must do the following things:
- Make sure the OED display switch is in the ON position (if not, you know what to do!).
- Optional: turn it on if the anti-cheat suddenly swears in the game.
- Optional: affects the display method (roughly speaking, the font) of the OED. It is best to choose Raster 3D, where you can customize the font by clicking on the Raster 3D inscription again.
- It is better to turn on the shadow of the font (switch it to the ON position).
- Choose the OED font color to suit your taste!
- Squares at the corners of the monitor - quick way move the OED to the desired corner of the monitor. Or you can simply drag the OED with the mouse, or set its coordinates manually.

That's probably all about quick setup MSI Afterburner for monitoring the processor and video card in the game. If you need detailed review program features, see one of best videos on this topic from Artyom:
Hi all! I recently wondered if there is a computer with graphics program and sometimes it slows down when working with projects. I looked at the computer loading in the task manager and see that the RAM is being strained, but perhaps the video card is also loaded... But how can I see how the video card is loading? Now I will show 3 programs in which you can see all the statistics!
How to see the load on the video card?
I picked 3 best programs, and consider each of them.
Process Explorer
This program best shows the load graph; when analyzing a computer for what the computer lacks, I would choose it. To see the graphs, you need to select System Information.

There are 3 parameters here, these are GPU Usage - loading of the video card chip.
GPU Dedicated Memory is the RAM of the video card
GPU System Memory - I haven’t fully understood this point. They write that it is RAM, but it is not. Graphics system memory. But where it comes from is not entirely clear) This parameter seems to be important if there is no external video card and the built-in memory is used together with the RAM. All in all good program, in which you can track the load graph.

After reading the reviews previous program, many complained about compatibility. But this one seems to work for everyone operating systems Oh. You can view brief and detailed information.
There is no load in this picture.

And here I strained the video card a little with a graphics editor.

If you click View - Detailed mode, you can see detailed statistics.

GPU-Z
This program is in demand by many gamers and overclockers)) What I liked about it is that you can track the minimum and maximum load on the video card.

For example, if you click on any box with a value, you can see that the words min, max appear in the corner... For example, you noticed that the video card began to slow down the graphics and the cooler began to spin quickly. We look at the simple temperature, for example 36°, set the value to max and launch a heavy game. If we see that the temperature is more than 80-90, then we should think about replacing the thermal paste. But depending on the assembler company, the temperature may be different. For example, I accelerated mine to a maximum of 76°. I have an Asus builder, and a friend has a Palit, for example, and the exact same video card heats up to 86°.

This is how you can find out the load on the video card. In the first program you can not only check the load on the video card, but also monitor the load on the processor, memory, hard drive and video cards in games and any programs.
The previous article compiled a list of 80 monitoring tools Linux systems. It also made sense to make a selection of tools for the Windows system. The following is a list that serves as a starting point only, there is no ranking.
1.Task Manager

The well-known Windows Task Manager is a utility for displaying a list of running processes and the resources they consume. But do you know how to use its full potential? As a rule, it is used to monitor the state of the processor and memory, but you can go much further. This application is pre-installed on all Microsoft operating systems.
2. Resource Monitor
A great tool to estimate CPU usage, random access memory, network and disks in Windows. It allows you to quickly obtain all the necessary information about the status of critical servers.

3.Performance Monitor

The main tool for managing performance counters in Windows. Performance Monitor, in earlier Windows versions known to us as System Monitor. The utility has several display modes, displays performance counters in real time, and saves data to log files for later study.
4.Reliability Monitor

Reliability Monitor - System stability monitor, allows you to monitor any changes in computer performance, you can find the stability monitor in Windows 7, in Windows 8: Control Panel > System and Security > Action Center. Using Reliability Monitor, you can keep track of changes and failures on your computer, the data will be displayed in a convenient graphical form, which will allow you to track which application and when caused an error or froze, track the occurrence of blue screen death of Windows, the reason for its appearance (another Windows update or installing a program).
5.Microsoft SysInternals

SysInternals is a complete set of programs for administering and monitoring computers running Windows OS. You can download them for yourself for free on the Microsoft website. Sysinternals utility programs help manage, troubleshoot, and diagnose applications and operating systems. Windows systems.
6. SCOM (part of Microsoft System Center)

System Center is a complete set of tools for managing IT infrastructure, with which you can manage, deploy, monitor, configure Microsoft software (Windows, IIS, SQLServer, Exchange, and so on). Unfortunately, MSC is not free. SCOM is used for proactive monitoring of key IT infrastructure objects.
Monitoring Windows servers using the Nagios family
7. Nagios

Nagios has been the most popular infrastructure monitoring tool for several years (for Linux and Windows). If you are considering Nagios for Windows, then install and configure the agent on Windows server. NSClient++ monitors the system in real time and provides outputs from a remote monitoring server and more.
8. Cacti

Typically used in conjunction with Nagios, it provides the user with a convenient web interface to the RRDTool utility, designed to work with Round Robin Databases, which are used to store information about changes in one or more quantities over a certain period of time. Statistics on network devices are presented in the form of a tree, the structure of which is specified by the user; you can plot channel usage, HDD partition usage, display resource latency, etc.
9. Shinken

A flexible, scalable, open source monitoring system based on the Nagios core written in Python. It is 5 times faster than Nagios. Shinken is compatible with Nagios, you can use its plugins and configurations without making adjustments or additional configuration.
10. Icinga

Another popular one open system monitoring, which checks hosts and services and reports their status to the administrator. As a fork of Nagios, Icinga is compatible with it and they have a lot in common.
11. OpsView

OpsView was originally free. Now, unfortunately, users of this monitoring system have to shell out money.

Op5 is another open source monitoring system. Plotting, storing and collecting data.
Alternatives to Nagios
13. ZabbixOpen software for monitoring and tracking the status of various services computer network, servers and network equipment, is used to obtain data about processor load, network usage, disk space and the like.
14. Munin

A good monitoring system that collects data from several servers simultaneously and displays everything in the form of graphs, with which you can track all past events on the server.
15.Zenoss

Written in Python using the Zope application server, data is stored in MySQL. With Zenoss you can
monitor network services, system resources,device performance,Zenoss core analyzes the environment. This makes it possible to quickly deal with big amount specific devices.
16. Observium

A monitoring and surveillance system for network devices and servers, although the list of supported devices is huge and is not limited to network devices; the device must support SNMP.
17. Centreon

A comprehensive monitoring system allows you to monitor the entire infrastructure and applications containing system information. Free alternative Nagios.
18. Ganglia

Ganglia is a scalable distributed monitoring system used in high-performance computing systems, such as clusters and grids. Monitors statistics and computation history in real time for each of the monitored nodes.
19. Pandora FMS

Monitoring system, good productivity and scalability, one monitoring server can monitor the work of several thousand hosts.
20. NetXMS

Open Source Monitoring Software computer systems and networks.
21.OpenNMS

OpenNMS monitoring platform. Unlike Nagios, it supports SNMP, WMI and JMX.
22. HypericHQ

A component of the VMware vRealize Operations suite, it is used to monitor OS, middleware and applications in physical, virtual and cloud environments. Displays availability, performance, usage, events, logs, and changes at every level of the virtualization stack (from the vSphere hypervisor to guest OSes).
23. Bosun

Open source monitoring and alert system from StackExchange. Bosun has a well-thought-out data design, as well as a powerful language for processing it.
24. Sensu

Sensu is an open source alert system similar to Nagios. There is a simple dashboard, you can see a list of clients, checks and triggered alerts. The framework provides the mechanisms needed to collect and accumulate server operation statistics. Each server runs a Sensu agent (client) that uses a set of scripts to check the functionality of services, their status and collect any other information.
25. CollectM
CollectM collects statistics about system resource usage every 10 seconds. It can collect statistics for several hosts and send it to the server, the information is displayed using graphs.
28. Performance Analysis of Logs (PAL) Tool
34. Total Network Monitor

This is a program for continuous monitoring of work local network individual computers, network and system services. Total Network Monitor generates a report and notifies you about errors that have occurred. You can check any aspect of the service, server or file system: FTP, POP/SMTP, HTTP, IMAP, Registry, Event Log, Service State and others.
35. PRTG

38.Idera

Supports multiple operating systems and virtualization technologies. There are many free tools that you can use to monitor your system.
39. PowerAdmin

PowerAdmin is a commercial monitoring solution.
40. ELM Enterprise Manager
ELM Enterprise Manager - complete monitoring from “what happened” to “what is happening” in real time. Monitoring tools in ELM include - Event Collector, Performance Monitor, Service Monitor, Process Monitor, File Monitor, PING Monitor.
41.EventsEntry

42. Veeam ONE

An effective solution for monitoring, reporting and scheduling resources in VMware, Hyper-V and Veeam Backup & Replication infrastructure, monitors the health of your IT infrastructure and diagnoses problems before they interfere with user experience.
43. CA Unified Infrastructure Management (formerly CA Nimsoft Monitor, Unicenter)

Monitors the performance and availability of Windows server resources.
44. HP Operations Manager

This infrastructure monitoring software performs proactive root cause analysis, reducing recovery time and reducing operations management costs. The solution is ideal for automated monitoring.
45.Dell OpenManage

OpenManage (now Dell Enterprise Systems Management) is an all-in-one monitoring product.
46. Halcyon Windows Server Manager

Management and monitoring of networks, applications and infrastructure.
Below is a list of (most popular) network monitoring tools
54.Ntop
55.NeDi

Nedi is an open source network monitoring tool.
54. The Dude

The Dude monitoring system, although free, is, according to experts, in no way inferior to commercial products; it monitors individual servers, networks and network services.
55.BandwidthD

Open source program.
56. NagVis

An extension for Nagios that allows you to create infrastructure maps and display their status. NagVis supports a large number of various widgets, icon sets.
57. Proc Net Monitor

A free monitoring application that allows you to track all active processes and, if necessary, quickly stop them to reduce the load on the processor.
58. PingPlotter

Used to diagnose IP networks, allowing you to determine where losses and delays occur network packets.
Small but useful tools
The list wouldn't be complete without mentioning a few hardware monitoring options.60. Glint Computer Activity Monitor

61.RealTemp

Temperature monitoring utility Intel processors, it does not require installation, monitors the current, minimum and maximum temperature values for each core and the start of throttling.
62. SpeedFan

A utility that allows you to control the temperature and fan speeds in the system, monitors sensor readings motherboard, video cards and hard drives.
63.OpenHardwareMonitor

 Order 343 mail. Order by Russian post. Consequences of failure to appear in court when summoned
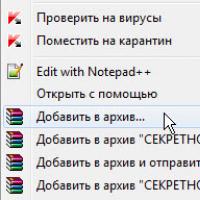 How to put a password on a folder on a Windows computer without and with programs
 Pluton – Free Bootstrap HTML5 One Page Template
 History of ZX Spectrum: Myths and reality New Spectrum
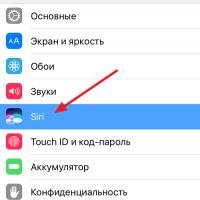 Voice assistant Siri from Apple Siri functions on iPhone 6s
 How to roll back to a previous version of iOS?
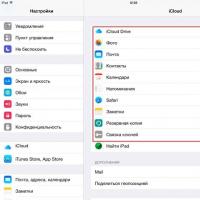 Unlock iPad in four days